データフレーム準備
「R言語」で作る「tibble」形式のデータフレームには色々なオブジェクトが入れられるそうです。
→参考サイトはこちら。
試してみました。
# irisデータを使う

library(tidyverse)

data(iris)
## tibble形式に変換
iris_df <-
as_tibble(iris)
iris_df
# A tibble: 150 × 5
Sepal.Length Sepal.Width Petal.Length Petal.Width Species
<dbl> <dbl> <dbl> <dbl> <fct>
1 5.1 3.5 1.4 0.2 setosa
2 4.9 3 1.4 0.2 setosa
3 4.7 3.2 1.3 0.2 setosa
4 4.6 3.1 1.5 0.2 setosa
5 5 3.6 1.4 0.2 setosa
6 5.4 3.9 1.7 0.4 setosa
7 4.6 3.4 1.4 0.3 setosa
8 5 3.4 1.5 0.2 setosa
9 4.4 2.9 1.4 0.2 setosa
10 4.9 3.1 1.5 0.1 setosa
# … with 140 more rows
# ℹ Use `print(n = ...)` to see more rowsデータフレームにデータフレームを入れる
後出のデータフレーム「iris_df_A」の内容確認で、「<tibble [50 × 5]>」と50行x5列のデータフレームを収録していることを示しています。
# 種類(Species)を確認
iris_Spec <-
  iris_df %>%
  distinct(Species)
iris_Spec

# A tibble: 3 × 1
Species
<fct>
1 setosa
2 versicolor
3 virginica
# 種類を行項目とし、データフレームの中に
# 種類別のデータフレームを収録
# まず各種類別のデータフレームを作る
# "setosa"だけを含むデータフレーム
iris_df_set <-
iris_df %>%
filter(Species == "setosa")
iris_df_set
# "versicolor"だけを含むデータフレーム
iris_df_ver <-
iris_df %>%
filter(Species == "versicolor")
iris_df_ver
# "virginica"だけを含むデータフレーム
iris_df_vir <-
iris_df %>%
filter(Species == "virginica")
iris_df_vir# 上記3つのデータフレームを
# 「setosa」「versicolor」「virginica」格行の2列目に収録
iris_df_A <-
iris_Spec %>%
mutate(
Species_df =
list(
iris_df_set, iris_df_ver, iris_df_vir
)
)
iris_df_A
# A tibble: 3 × 2
Species Species_df
<fct> <list>
1 setosa <tibble [50 × 5]>
2 versicolor <tibble [50 × 5]>
3 virginica <tibble [50 × 5]># 確認
iris_df_A %>%
pluck("Species_df", 1)
# A tibble: 50 × 5
Sepal.Length Sepal.Width Petal.Length Petal.Width Species
<dbl> <dbl> <dbl> <dbl> <fct>
1 5.1 3.5 1.4 0.2 setosa
2 4.9 3 1.4 0.2 setosa
3 4.7 3.2 1.3 0.2 setosa
4 4.6 3.1 1.5 0.2 setosa
5 5 3.6 1.4 0.2 setosa
6 5.4 3.9 1.7 0.4 setosa
7 4.6 3.4 1.4 0.3 setosa
8 5 3.4 1.5 0.2 setosa
9 4.4 2.9 1.4 0.2 setosa
10 4.9 3.1 1.5 0.1 setosa
# … with 40 more rows
# ℹ Use `print(n = ...)` to see more rowsデータフレームにグラフを収録(散布図)
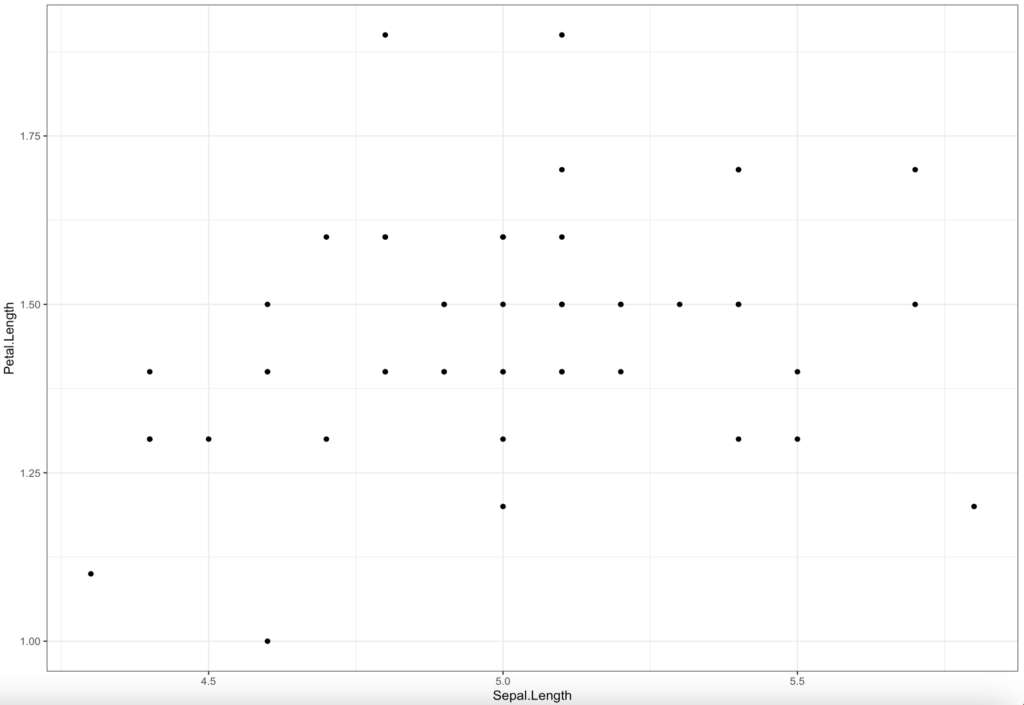
後述のデータフレーム「iris_df_B」の内容確認で、「<gg>」というグラフオブジェクトを収録している状態を表示しています。
# グラフも収録
# まずグラフを作成

# 散布図
iris_df_set2 <-
  iris_df_set %>%
  ggplot(
    aes(x = Sepal.Length, y = Petal.Length)
    ) +
  geom_point() +
  theme_bw()

iris_df_ver2 <-
  iris_df_ver %>%
  ggplot(
    aes(x = Sepal.Length, y = Petal.Length)
  ) +
  geom_point() +
  theme_bw()

iris_df_vir2 <-
  iris_df_vir %>%
  ggplot(
    aes(x = Sepal.Length, y = Petal.Length)
  ) +
  geom_point() +
  theme_bw()
# データフレームに収録
iris_df_B <-
iris_df_A %>%
mutate(
Species_gg1 =
list(
iris_df_set2, iris_df_ver2, iris_df_vir2
)
)
iris_df_B
# A tibble: 3 × 3
Species Species_df Species_gg1
<fct> <list> <list>
1 setosa <tibble [50 × 5]> <gg>
2 versicolor <tibble [50 × 5]> <gg>
3 virginica <tibble [50 × 5]> <gg> # 確認
iris_df_B %>%
pluck("Species_gg1", 1)
データフレームにグラフを収録(棒グラフ)
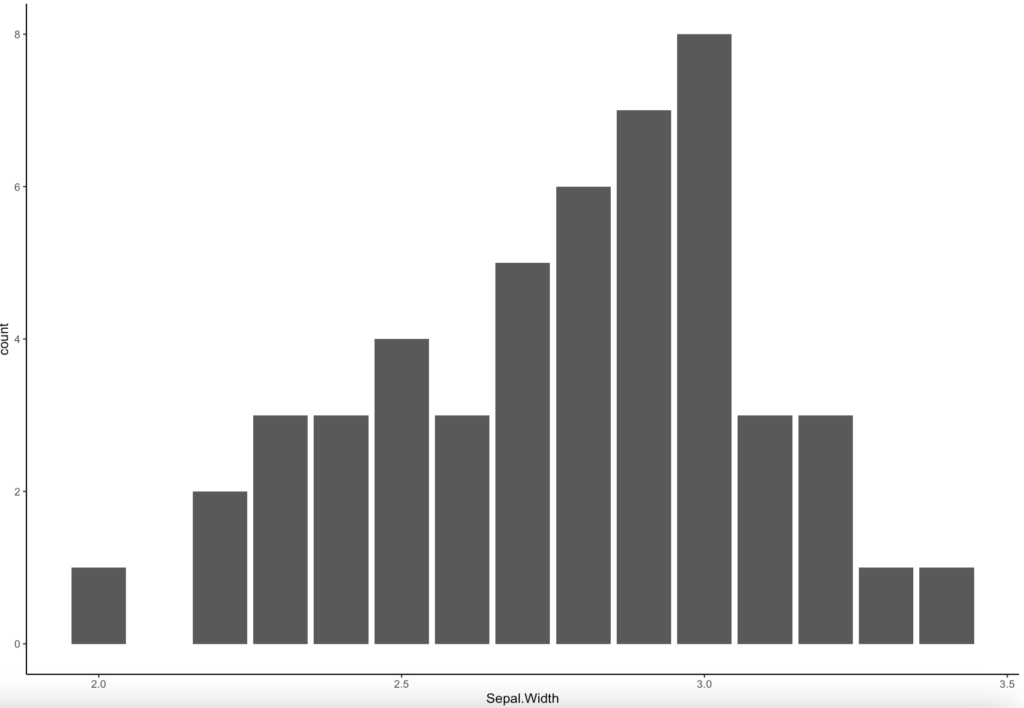
同様にグラフオブジェクト「<gg>」がデータフレームに入っています。
# 棒グラフ。Sepal.Widthの値の個数をy軸に
iris_df_set3 <-
  iris_df_set %>%
  ggplot(
    aes(x = Sepal.Width)
  ) +
  geom_bar() +
  theme_classic()
iris_df_set3

iris_df_ver3 <-
  iris_df_ver %>%
  ggplot(
    aes(x = Sepal.Width)
  ) +
  geom_bar() +
  theme_classic()
iris_df_ver3

iris_df_vir3 <-
  iris_df_vir %>%
  ggplot(
    aes(x = Sepal.Width)
  ) +
  geom_bar() +
  theme_classic()
iris_df_vir3
# データフレームに収録
iris_df_C <-
iris_df_B %>%
mutate(
Species_gg2 =
list(
iris_df_set3, iris_df_ver3, iris_df_vir3
)
)
iris_df_C
# A tibble: 3 × 4
Species Species_df Species_gg1 Species_gg2
<fct> <list> <list> <list>
1 setosa <tibble [50 × 5]> <gg> <gg>
2 versicolor <tibble [50 × 5]> <gg> <gg>
3 virginica <tibble [50 × 5]> <gg> <gg> # 確認
iris_df_C %>%
pluck("Species_gg2", 2)
データフレームに関数を収録(1)
変数にデータフレームを使う関数を用意します。
後出の「<fn>」が関数オブジェクトです。
# 関数準備
# 自作関数作成。
# データフレームを変数にし、Sepal.Length >= 5.5をピックアップする関数
SepalLength_F = function(df){
  pick_SepalLength =
    df %>%
    filter(Sepal.Length >= 5.5)
  return(pick_SepalLength)
}
# 関数をデータフレームに追加
iris_df_C_func =
iris_df_C %>%
mutate(
func =
list(
SepalLength_F
)
)
iris_df_C_func
# A tibble: 3 × 5
Species Species_df Species_gg1 Species_gg2 func
<fct> <list> <list> <list> <list>
1 setosa <tibble [50 × 5]> <gg> <gg> <fn>
2 versicolor <tibble [50 × 5]> <gg> <gg> <fn>
3 virginica <tibble [50 × 5]> <gg> <gg> <fn> # 確認
# 「<bytecode: 0x14baccbc8>」は関数のバイトコードオブジェクトで、
# このオブジェクト自体には問題なそうです。
iris_df_C_func %>%
pluck("func", 1)
function(df){
pick_SepalLength =
df %>%
filter(Sepal.Length >= 5.5)
return(pick_SepalLength)
}
<bytecode: 0x14baccbc8>作成した関数の振る舞いは以下のようになります。
# 関数動作確認
iris_df_C_func %>% pluck("Species_df", 1) %>%
  SepalLength_F()

# A tibble: 5 × 5
  Sepal.Length Sepal.Width Petal.Length Petal.Width Species
         <dbl>       <dbl>        <dbl>       <dbl> <fct>
1          5.8         4            1.2         0.2 setosa
2          5.7         4.4          1.5         0.4 setosa
3          5.7         3.8          1.7         0.3 setosa
4          5.5         4.2          1.4         0.2 setosa
5          5.5         3.5          1.3         0.2 setosa
関数適用結果をデータフレームに入れる(1)
関数にデータフレームを代入し出力した結果をデータフレームに入れてみます。
しかし、エラーが出てしまいました。
# 関数適用結果をデータフレームに収録

iris_df_C_func_output =
  iris_df_C_func %>%
  mutate(
    func_output =
      list(
        func(Species_df)
      )
  )

Error in `mutate()`:
! Problem while computing `func_output = list(func(Species_df))`.
Caused by error in `func()`:
! could not find function "func"
Run `rlang::last_error()` to see where the error occurred.
このエラーの解決方法がわかりませんでした
この関数が入っているデータフレーム「iris_df_C_func」を見ると、「Species_df」列が「<list>」型になっています。
iris_df_C_func

# A tibble: 3 × 5
  Species    Species_df        Species_gg1 Species_gg2 func
  <fct>      <list>            <list>      <list>      <list>
1 setosa     <tibble [50 × 5]> <gg>        <gg>        <fn>
2 versicolor <tibble [50 × 5]> <gg>        <gg>        <fn>
3 virginica  <tibble [50 × 5]> <gg>        <gg>        <fn>
「<list<tibble[,x]>>」という型にしないといけないようです。
この型への変換方法がわかりませんでした。
データフレームに関数を収録(2)
今回は、関数をデータフレームに収録する確認は、参考にしたサイト同様に「nest_by」関数を使うことにしました。
「nest_by」で種類別のデータフレームをデータフレームに収録し、併せて先ほど作った関数を「func」という列に入れています。
(グラフの収録はしていません)
##ここでnest_by使ってみる
# 自作関数追加

iris_df_C_func_output2 =
  iris %>%
  nest_by(Species) %>%
  mutate(
    func =
      list(
        SepalLength_F
      )
  )
iris_df_C_func_output2

# A tibble: 3 × 3
# Rowwise:  Species
  Species                  data func
  <fct>      <list<tibble[,4]>> <list>
1 setosa               [50 × 4] <fn>
2 versicolor           [50 × 4] <fn>
3 virginica            [50 × 4] <fn>
(自動でできる)「data」列は「<list<tibble[,4]>>」という型の列の中に、データフレームが入っています。
関数適用結果をデータフレームに入れる(2)
改めて関数にデータフレームを代入し出力した結果をデータフレームに入れてみます。
今回は収録できました。
# 関数適用
iris_func_Result2 =
  iris_df_C_func_output2 %>%
  mutate(
    df_SepalLength_out =
      list(
        func(data)
      )
  )
iris_func_Result2

# A tibble: 3 × 4
# Rowwise:  Species
  Species                  data func   df_SepalLength_out
  <fct>      <list<tibble[,4]>> <list> <list>
1 setosa               [50 × 4] <fn>   <tibble [5 × 4]>
2 versicolor           [50 × 4] <fn>   <tibble [44 × 4]>
3 virginica            [50 × 4] <fn>   <tibble [49 × 4]>
# 確認
iris_func_Result2 %>%
pluck("df_SepalLength_out", 1)
# A tibble: 5 × 4
Sepal.Length Sepal.Width Petal.Length Petal.Width
<dbl> <dbl> <dbl> <dbl>
1 5.8 4 1.2 0.2
2 5.7 4.4 1.5 0.4
3 5.7 3.8 1.7 0.3
4 5.5 4.2 1.4 0.2
5 5.5 3.5 1.3 0.2
